In this time of extraordinary change and uncertainty, reaction has been rapid, well meaning and often effective at the individual, enterprise and nationwide level. But throughout the growth of the coronavirus pandemic, we have consistently been on the back foot. Now public attention has started shifting towards the innovation that is starting to occur everywhere as we try to invent our way out of the crisis. In a series of articles, Professor Gwilym Roberts (Chair of Kilburn & Strode) and Costas Stephanides (Technical Manager at RWS Information) will turn the focus onto the world of patenting to see if we can shift the balance just a little towards the front foot.
Our first article is an analytical review of patenting activity in previous economic and global crises, in the second we adopt a historical stance to see how innovation has fared in the past as a result of those crises, and in the third we shift to the front foot and hypothesise around future innovation trends arising from the current pandemic.
Patents during crisis
A mantra that the patent profession has rolled out in the past is that patents are by and large recession proof. This may be wishful thinking, but there’s no doubt that over the last 20 or 30 years, despite various crises, the patent system has been booming, underpinning successive explosions in innovation. However, it is illustrative to look at the numbers underlying this empirical statement to assess the reality of the situation. Kilburn and Strode collaborated with RWS to analyse patenting activities during three previous major global crises: World War II, the oil crisis of 1973, and the “Great Recession” of 2008, and see whether we can extrapolate to the aftermath of the current pandemic. Reassuringly, the overall trend over the last century is one of constant growth, but drill down and the data is fascinating. The correlation at the micro level is stark and even permits corroboration of other crises over the period reviewed.
The overall trend
Even though the records are a little patchy pre-1960 (principally US and European data is available for that period, and even now Africa and South America are not totally accurately documented), reassuringly, the last century shows an astonishing growth in patenting activity. From (comparatively), negligible numbers in the early 1930s the total number of patent applications has increased on an accelerating curve. There are dips, and the difference between application and grant numbers rates varies partly for administrative reasons, but the relentless growth is evident from graph 1 below.
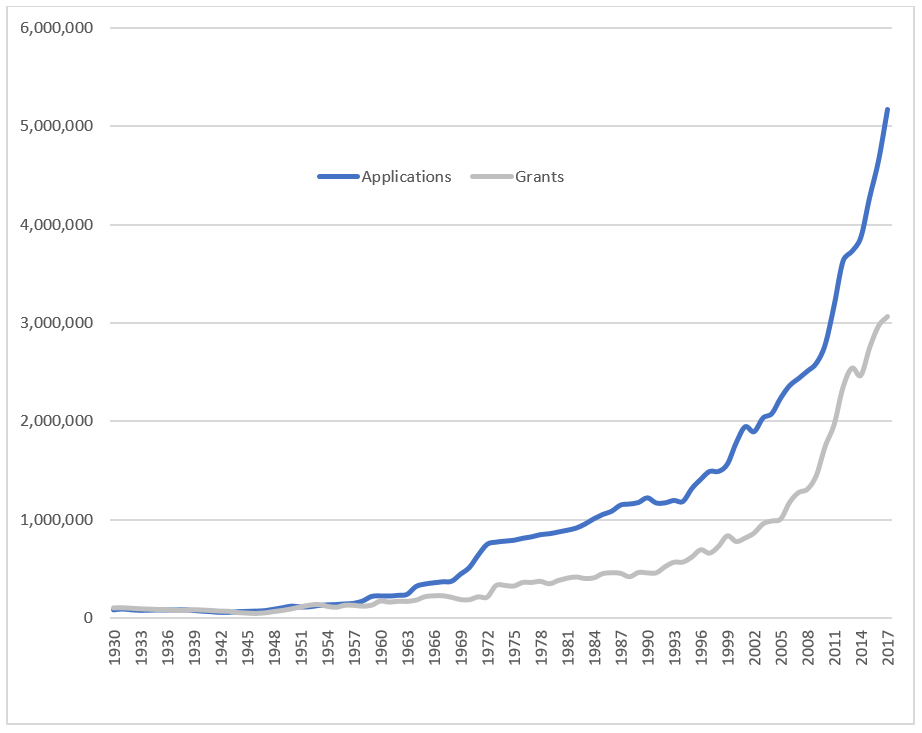
Graph 1 – “global” patent applications (blue) and grants (grey) 1930-present
It’s important to stress that the numbers looked at relate specifically to patenting – a measurable indication of innovation but separate from the act of innovation itself. It’s quite possible that many other innovations will have been developed during the crisis periods in response to the specific stimuli at the time but which were either not of a technological nature susceptible to patenting, or simply not pursued through the patenting system because short or long term economic benefit could not be seen for it. Even so, focussing on patenting is a strong indicator of innovation, and also points to the level of awareness of potential future economic benefit for innovations occurring during a time of crisis.
Patenting during and after World War II
A lot of the dips and bumps are smoothed out because of the scale of graph 1, but if we shine a light on the period 1930-1960, a more detailed story emerges from graph 2. Focus here on the blue plot – patent application filings. The introductory period itself is revealing – as we explore in more detail below, the three key crises we’ve highlighted are not the only ones that emerge from the patent data and the dip at 1930 could be attributed to the aftermath of The Great Depression or a global economy fixated on tooling up for more war. The application level drops to a minimum around 1942-1943 and then starts rising again rapidly once the war has finished. The grant level – the grey line - dropped rather lower and didn’t catch up for a long time, an interesting reminder of the difficulty of restructuring and rebuilding the basic services of government (it takes one patent attorney to file a patent application but a fully operative government department to grant a patent).
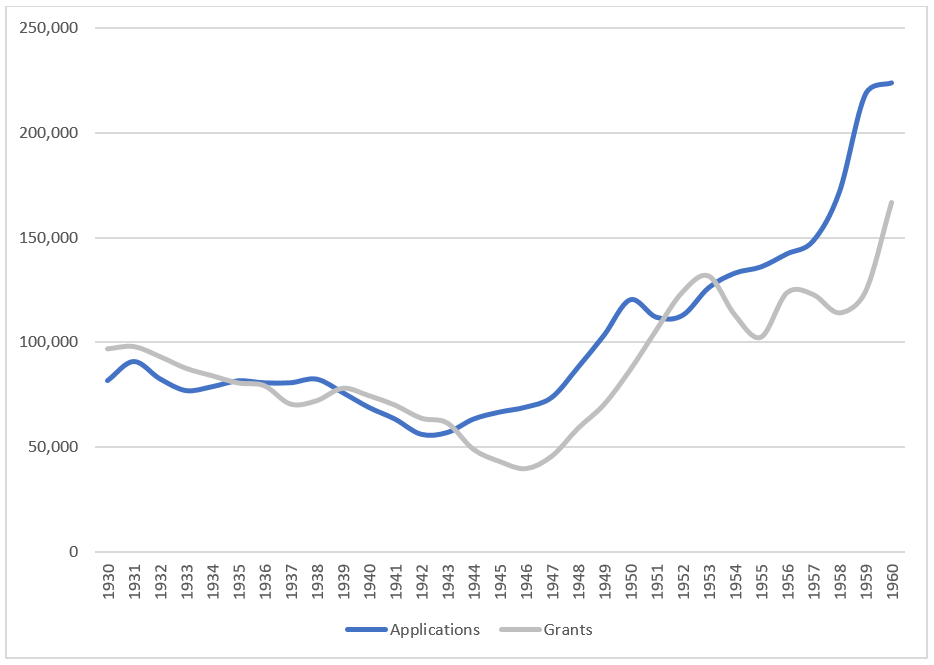
Graph 2 – “global” patent applications (blue) and grants (grey) 1930-1960
The geopolitical situation is reflected very clearly in graph 3 which shows a consistent pattern of US filings (the blue bars) and a similar pattern for the UK albeit with a slight dip mid-war (purple bars). However, the impact on Germany’s economy immediately after the war is terrifying – possibly for administrative reasons but undoubtedly because of the need to reconstruct an entire infrastructure, patenting is negligible to zero (a similar blip in 1930 could be attributed to the huge impact of The Great Depression on the Weimar Republic, still recovering from hyper-inflation). But the growth in patenting in Germany from 1948 through the 1950’s is astounding – perhaps a perfect example of the cycle of “creative destruction” being stimulated by the overwhelming impact of the Second World War.
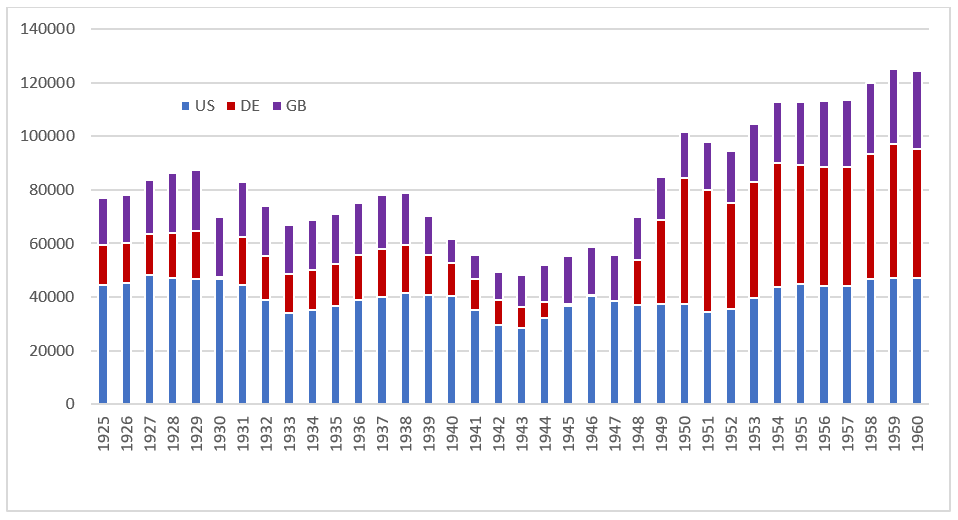
Graph 3 US (blue bar) German (red bar) and GB (purple bar) patent applications 1925-1960
As an aside, the data also shows that the majority of patent activity by the biggest filers was very much domestic – this was pre-globalisation in terms of patent filing strategies and, presumably, commercial intent. The bureaucratic difficulty of international protection would have contributed as well – multiple-country patent filing was no easy task in those days, before the deregulation provided by the introduction of the PCT in the seventies.
At least in the three territories studied, the war saw a cumulative dip in patenting followed by a boom, with both patterns most evident in the country whose economy was hardest hit. In the next article we will look at the nature of innovation during and after World War II, but first it is worth considering whether we see similar patenting patterns for other periods of global stress.
The Oil crisis
Without getting into huge detail, the prosperity that eventually followed World War II, especially in the US, led to hugely increasing demands for oil-derived products into the late 1960’s. International tensions led to oil producing countries in the middle east announcing an embargo and raising world oil prices, and the effect was recession from around 1973.
Going back to graph 1, whilst there had been growth in patenting up to 1973 visible in a fairly significant step from around 1968, this flattened significantly for the remainder of the seventies. There’s no evident dip, however, and this might be explained when we examine more closely patents classed as having technology relating to renewable energy (including nuclear energy) over the quarter century from 1971. Looking at graph 4, part of the reason may be that patenting reductions in some areas were partially offset by a doubling of filings in this specific technology between 1973 and 1979. As discussed in the next article, the scramble across the world to render countries less dependent on imported oil was an early accelerator for the current drive for green technology, albeit for different reasons. And it is notable that this was not the only spike – there was a further peak around 1981 at the time of the second oil crisis, and prominent spike again in 1987 which would correspond to the Chernobyl crisis. A little bit like deriving historical events from tree rings, drilling down into the patent data provides echoes of global events at the time.
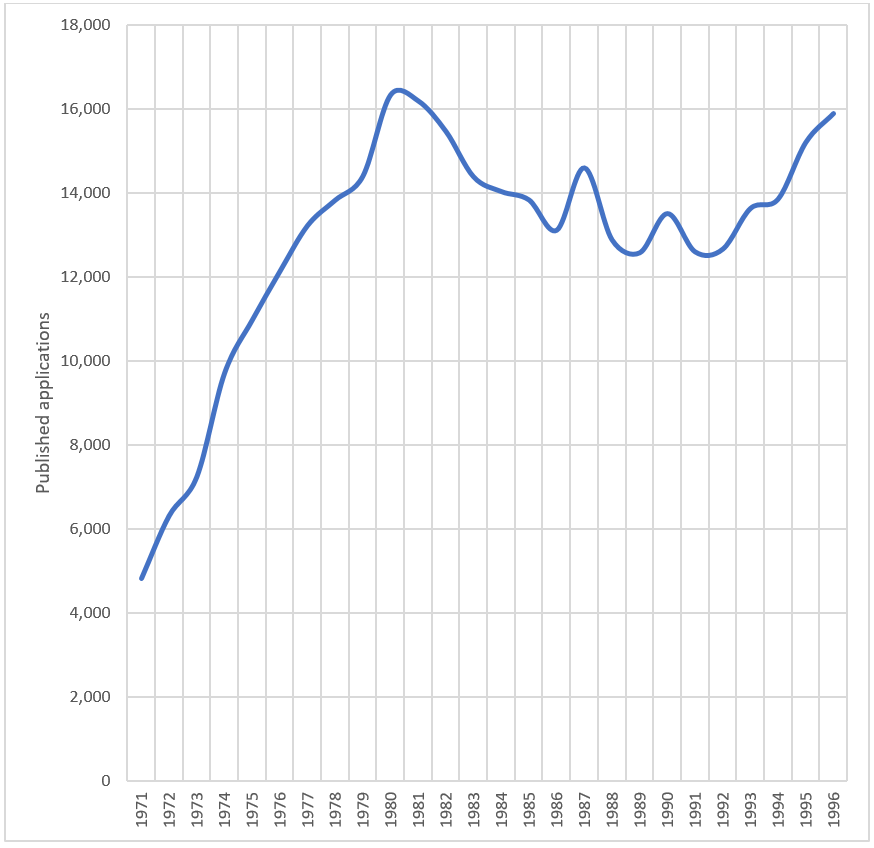
Graph 4 patent filings – renewable energy 1971-1996
The Great Recession
Moving into “our era”, at least up until now the key crises seem rather secondary in nature compared to the primary threats of war and removal of energy source. Roughly speaking they were various financial crashes separated by a bursting dot com bubble. Graph 1 shows a flattening around the 1987 crash, another dip around 2000 (when people began to understand what the internet couldn’t do as well as what it could do) but rather less change around the “Great Recession” of 2007-2008. Focussing in on specific technology areas provides some background, and graph 5 shows the application filing activity from the mid-nineties in the area of two related technologies, finance and cryptography. Up until 2000 there was a huge growth – practically five-fold. This may well be attributed to the dot com bubble that was about to burst; anyone who was patenting in the computer related invention field at that time will remember the relentless stream of inventions relating to new uses of websites that appeared almost daily. The millennium bug came along in 2000 and following on from that the bubble burst, and the dip is clear although largely the increase then continued. The drop at around the time of the 2008 financial crisis can be seen fairly clearly but since then, as various national jurisdictions have begun to accept more computer related inventions, and since cryptography and complex technologies such as bitcoin have grown, we see a steady growth once more.
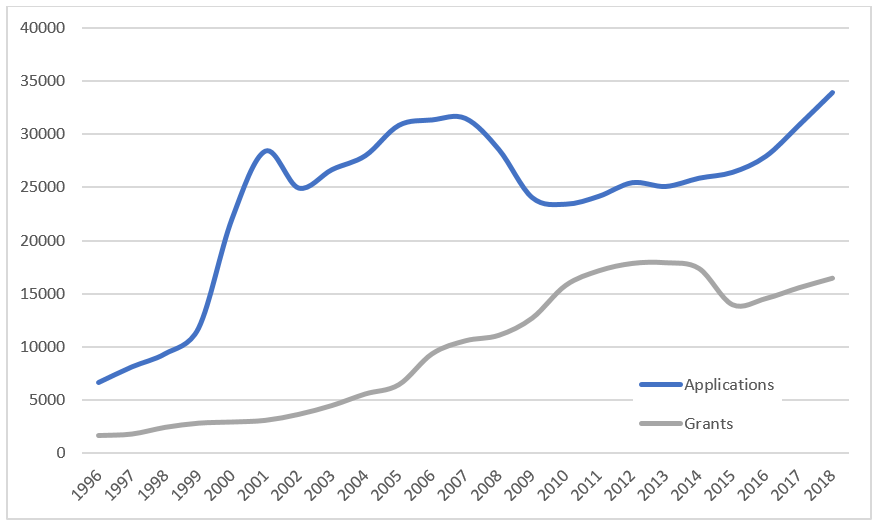
Graph 5 – total patent applications for finance+commerce+crypto 1996-present
All in all, patenting activity seems more resilient to these secondary types of crisis than to ones which affect basic human survival or needs.
Do major crises affect patenting?
Of course they do, but the nature of the crisis has a significant effect. World War II appears to have been the most powerful suppressant, the simple destruction of infrastructure outweighing the innovation efforts. However, the bounce back was strongest and, interestingly, most prominent in the economy worst hit of those studied. The more recent variations appear to have been more a matter of flattening or, in the case of the boom immediately preceding it, readjusting in the case of the dot com bubble, but typically followed by an increase in activity, again a possible manifestation of the “creative destruction” cyclic theory. Roughly speaking, running out of money has less impact than running out of infrastructure.
The nature of the crisis also has an impact on the type of innovation, and the economic handling of it, as will be discussed in detail in the next article. In brief, however a first major difference with the World War II situation is the defence related nature of many of the innovations that were occurring at that time. Furthermore, in the US it is estimated that there were around 11,000 patents that were kept secret for military reasons and it is certainly the case that in any crisis the public policy imperative underlying the patent system changes from incentivising long-term innovation to a short-term requirement for economic protection.
In terms of the other “real” crisis – the oil crisis – the nature of innovation during and following it was very much directed towards what we now term renewable energy; again the public policy imperative changes slightly because one can expect significant government incentives for development in these areas.
We can similarly expect a short-term policy change during the current pandemic – governments will obviously want to ensure that whilst innovation in e.g. anti-virals is paramount, access is essential as well; this makes perfect sense and we would likewise expect to revert more to the “long term reward for innovation” model of the “normal” economy as the crisis recedes.
It is sadly, but perhaps predictably, less easy to point to genuine benefits coming out of the various financial crises; they were rather more difficult to innovate out of and perhaps provide less useful historical perspective for the situation we find ourselves in now.
Overall, therefore, the data is unsurprising in gross terms; there has been a huge rise in patenting over the last century with significant dips or flattenings during global depressions followed by spurts of growth afterwards. Drilling a little further has provided some interesting insights including the ability to identify other crises that were not originally the subject of the exercise, and a possible correlation between the areas of the economy hardest hit, and the size of the jump after. Crisis is quick to drive innovation, and in the next article we look in more detail at the link between the nature of the crisis and the type of innovation, both during and after.
Don't miss out on the second article in the Innovation and crisis series which explores whether innovation is collateral damage or the one positive outcome of a crisis.
Contact Gwilym to discuss anything in this article. He loves a chat.
Many thanks to our co-author Costas Stephanides for contributing to this article.